W4118
Kernel Debugging using QEMU and GDB
This (rough) guide will tell you how to setup kernel debugging using
QEMU and
GDB/LLDB. This is
not intended to be used to solve all kernel debugging – if you can boot
using your kernel normally and it can do most things fairly stably, you could
probably still debug just fine using the old printk and dmesg combo.
However there inevitably comes a time when you are unable to even boot your kernel and are unable to get any information even from serial ports, possibly because the issues occur in your system in an early enough or critical enough code path such that none of these methods even egress any information. Then QEMU/GDB might be your best way forward.
We introduce a relatively simple process to debug a crashing kernel during boot, as well as a slightly more sophisticated process that will allow you to include custom binaries to your init image, so that you can invoke custom system calls or do more advanced things and observe your kernel’s responses.
One-time Setup
# for arm
$ sudo apt install qemu-system-aarch64 gdb
# for x86
$ sudo apt install qemu-system-x86 gdb
Per-run Setup
Before you start, I recommend you setup some sort of terminal multiplexer that
will let you be able to run multiple processes at once and see all their
consoles simultaneously. I recommend using tmux or zellij for terminal
multiplexing; both should be available on apt, but I suppose the built-in one
from VS Code also works. How they work is a topic of its own but definitely
something worth learning.
It is also assumed that at this point you have compiled your linux kernel and
are right before the step where you’d normally run sudo make install and the
rebooting into your kernel. With QEMU, you won’t be doing either.
For your first terminal, go into your linux directory, and then run:
# both assumes you are currently in the `linux` directory
# in your homework repo. Pick the one appropriate for you.

# for arm:
# ====================
# generic ARM virtual machine type;
# common ARM cpu;
# 2G of RAM for a minimal OS;
# kernel image that you made;
# initramfs;
# direct output to serial port; stabilize memory layout to ensure
# debugging doesn't jump to random source locations;
# disable GUI since we don't have any;
# open serial port on :1234; start paused
$ qemu-system-aarch64 \
  -M virt \
  -cpu cortex-a57 \
  -m 2G \
  -kernel arch/arm64/boot/Image \
  -initrd /boot/initrd.img-6.14.0-cs4118 \
  -append "console=ttyAMA0 nokaslr" \
  -nographic \
  -s -S

# for x86 (untested)
# ====================
# 2G of RAM for a minimal OS;
# kernel image that you made;
# initramfs;
# direct output to serial port; stabilize memory layout to ensure
# debugging doesn't jump to random source locations;
# disable GUI since we don't have any;
# open serial port on :1234; start paused
$ qemu-system-x86_64 \
  -m 2G \
  -kernel arch/x86_64/boot/bzImage \
  -initrd /boot/initrd.img-6.14.0-cs4118 \
  -append "console=ttyS0 nokaslr" \
  -nographic \
  -s -S
This might not seem to do anything, which is expected; -S will pause the
execution so that you can connect and resume at your leisure.
In a separate window, also go to your linux directory, and run
$ gdb vmlinux -ex "target remote :1234"
If you got something like the below or something even more meaningful:
Remote debugging using :1234
0x0000000040000000 in ?? ()
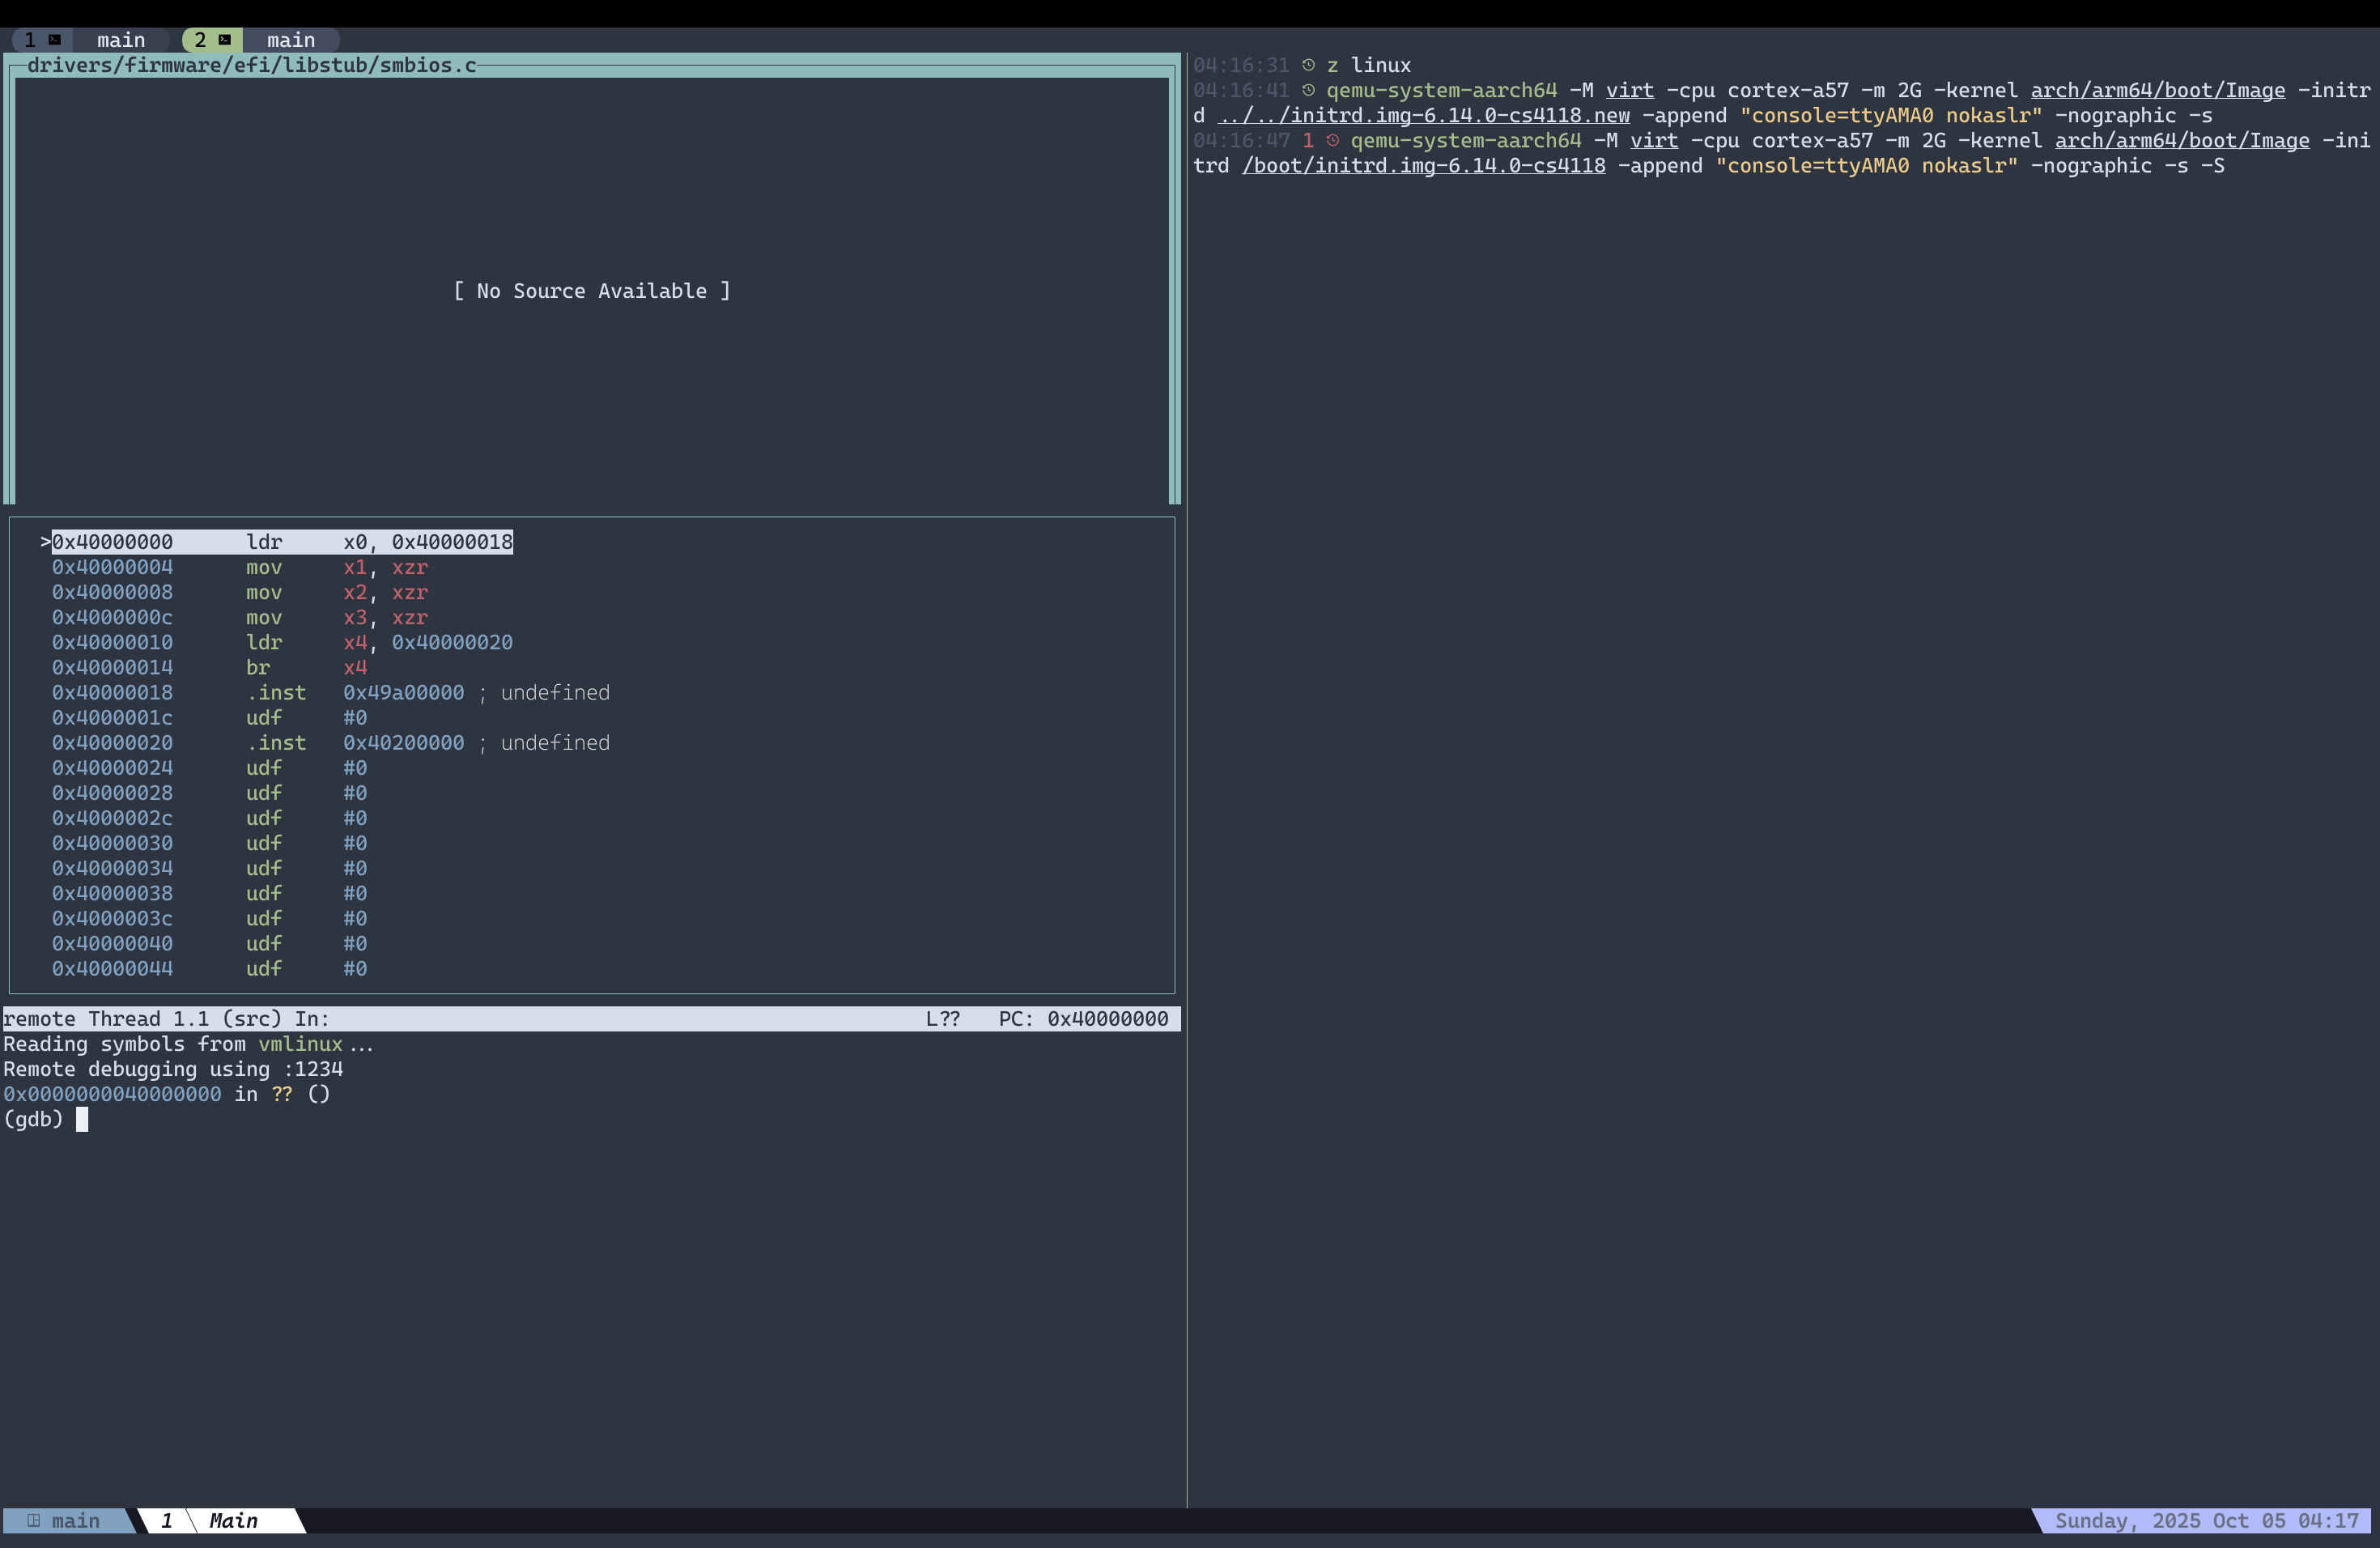
Then you are officially in. At this point, the linux kernel is paused, pending
input from the debugger. To let it continue running, you would input c for
“continue”, though you might want to set up some breakpoints first.
Typical Workflow
Before diving in, there are some things you can do to make the experience slightly better:
layout split
This will give you three separate panels – the top one for viewing source code, the middle one for assembly, and the bottom one for interacting with the debugger using a REPL.
Now you can do stuff like setting a breakpoint to a function that you know the
name of, and continue/c until the kernel reaches that point.
Adding breakpoint by function name:
break my_func
Regex breakpoint for a number of similar functions:
rbreak kernel/sched/oven.c:.*_oven
Then you can print values of variables:
print var  # prints variables visible in current scope
print var.field

backtrace  # shows stack trace
A few different ways to “continue” with execution:
c  # continue until next breakpoint
s  # step, diving into functions if any
n  # continue on current level, no function diving
finish  # step out of current function
Enter key press will automatically re-execute last command.
ctrl-c will stop execution directly.
Tips
Working with list_heads:
print *$container_of(rq.wfq.tasks.next, "struct task_struct", "wfq_list_node")
Setting up gdb to TUI mode and to auto-accept linux’s gdb python scripts:
- create
~/.gdbinit; -
Add as content:
layout split

add-auto-load-safe-path .
And you can find out more via this gdb cheatsheet, or read some guides.
Alternative Debugger - LLDB
You can use lldb instead of gdb and then connect to QEMU using
gdb-remote localhost:1234.
You can use some of the same or similar commands like b some_func, c to
continue, etc. It also has a fancier gui command that gives you a terminal
interface that gives you an interactable source code window, a variable panel,
and a list of threads.
You can move from one panel to another using <tab>, toggle breakpoints in the
source code panel using b, or run to highlighted line with <enter>.
h will give you the set of keymaps you can use in the current space.
Once you are done with the gui, <esc> will put you back to the command screen.
You can find out more at the official tutorial.
Teardown
$ killall qemu-system-aarch64
# or qemu-system-x86_64
Will stop the running QEMU process. lldb will turn off QEMU for you when you
exit, gdb will only detach.
Debugging with custom binary in Initramfs Image
You will realize that the mini-OS running with the initramfs that we specified doesn’t let you do a whole lot. It has only a few binaries, and seems pretty restrictive overall, as is expected. However, what if you want to test your new syscalls?
Fortunately, we can bring in custom binaries into the RAM filesystem, including binaries that you built that can test your kernel in various ways.
Before other things, you want to make sure to compile your binary with the
-static flag as the initramfs environment won’t have the usual dynamically
linked libraries that we need. You can likely just reuse the Makefile and add
the flag to CFLAGS.
Then, navigate so that you start from the linux directory in your homework
repo, which should be common ground for all students.
In both sets of per-arch instructions below, the commands used assumes you have been following the working directory changes very closely. If you deviate, make sure you update your commands accordingly or they likely won’t work.
ARM instructions
# if you are currently in the linux directory inside your team homework repo:
$ cd ../..

# create a working dir for the temporary RAM-based filesystem that QEMU uses
# for booting. Make it ouside your repo so we don't interfere unnecessarily.
$ mkdir initrd

# unpacks the version created normally using `make`
$ zstd -d /boot/initrd.img-6.14.0-cs4118 -o initrd.img.cpio

# go into the working dir
$ cd initrd
# extract content to current dir
$ sudo cpio -idm < ../initrd.img.cpio

# create tmp dir and move desired binary here
$ mkdir tmp
# the next time you want to update the binaries or add more content, you can
# start from this step here assuming you change working dir properly.
$ cp ${BINARY_PATH} tmp/

# (optional) make sure you are still in `initrd`
$ pwd

# bundle custom image file
$ find . | cpio -o -H newc | gzip -c > ../custom.img

# go to linux dir
$ cd ../
$ cd f25-hmwkN-teamM  # sub with your appropriate local version
$ cd linux

# run QEMU with revised command using the custom init image.
# Note the change in the `-initrd` argument!
$ qemu-system-aarch64 \
  -M virt \
  -cpu cortex-a57 \
  -m 2G \
  -kernel arch/arm64/boot/Image \
  -initrd ../../custom.img \
  -append "console=ttyAMA0 nokaslr" \
  -nographic \
  -s -S
X86 instructions
# if you are currently in the linux directory inside your team homework repo:
$ cd ../..

# create a working dir for the temporary RAM-based filesystem that QEMU uses
# for booting. Make it ouside your repo so we don't interfere unnecessarily.
$ mkdir initrd

# unpacks the version created normally using `make`
$ unmkinitramfs /boot/initrd.img-6.14.0-cs4118 ./initrd

# go into the working dir; ls should show three(?) dirs, early, early2 and main.
$ cd initrd && ls
$ cd main

# `main` here is the, well... the *main* stage of x86's multi-stage booting, and
# the only one that we really need to worry about. In here you should be able to
# find all the linux root stuff like `bin` and `lib` and most importantly,
# `init`.

# create tmp dir and move desired binary here
$ mkdir tmp
# the next time you want to update the binaries or add more content, you can
# start from this step here assuming you change working dir properly.
$ cp ${BINARY_PATH} tmp/

# (optional) make sure you are still in `main`
$ pwd

# bundle custom image file and place two level up -- one level is inside initrd.
# this step might take a little while.
$ find . | cpio -o -H newc | gzip -c > ../../custom.img

# go to linux dir
$ cd ../../
$ cd f25-hmwkN-teamM  # sub with your appropriate local version
$ cd linux

# run QEMU with revised command using the custom init image.
# Note the change in the `-initrd` argument!
$ qemu-system-x86_64 \
  -m 2G \
  -kernel arch/x86_64/boot/bzImage \
  -initrd ../../custom.img \
  -append "console=ttyS0 nokaslr" \
  -nographic \
  -s -S
Repacking
Similar for both arch, once you have done the above once, for all subsequent changes you want to make to the init ram file system, you can just do the file change and the repacking step as long as you don’t clean up the unpacked initrd directory. You can also simplify some of the steps with symlinks, which we won’t talk about here.
Running
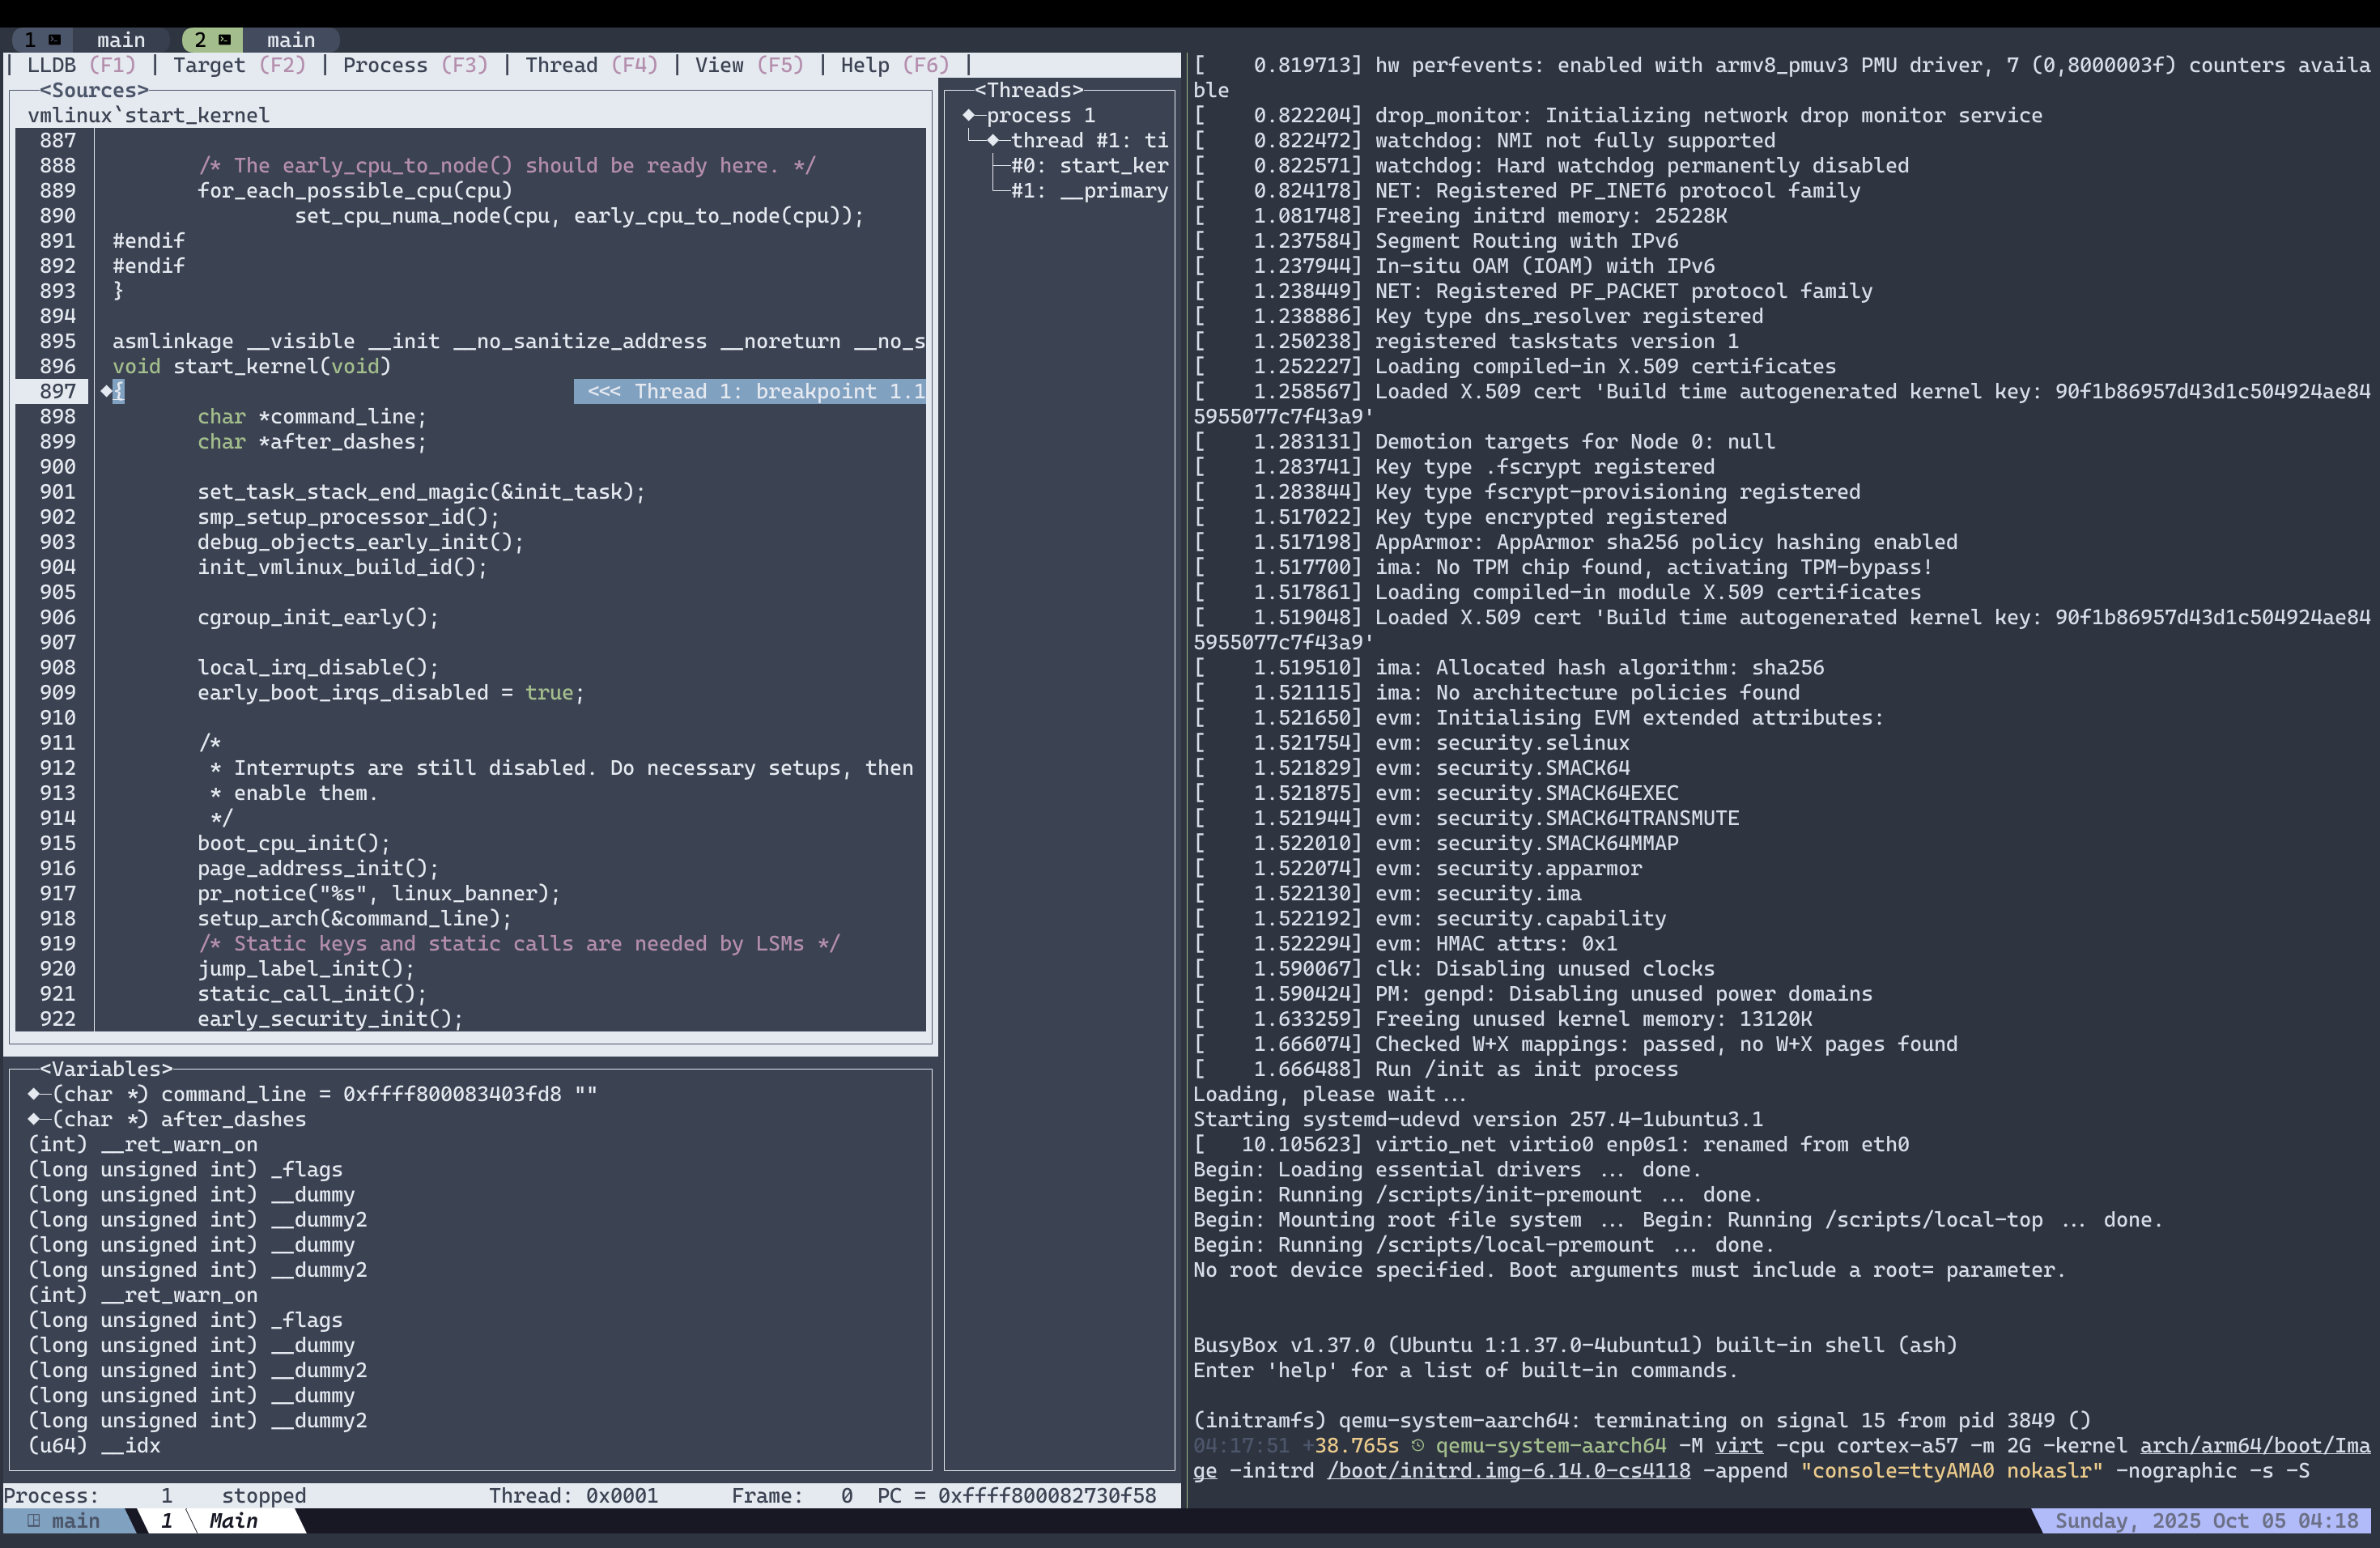
You should now be able to set a breakpoint to a custom kernel function that you
implemented and walk through it using your debugger of choice. Once you setup
QEMU and the debugger like before, click c to let QEMU resume booting, and it
will go through the booting process until getting to a shell:
(initramfs)
Now you can run your custom binary from the place you put it:
(initramfs) ./tmp/test
Sample GDB: 
Sample LLDB: 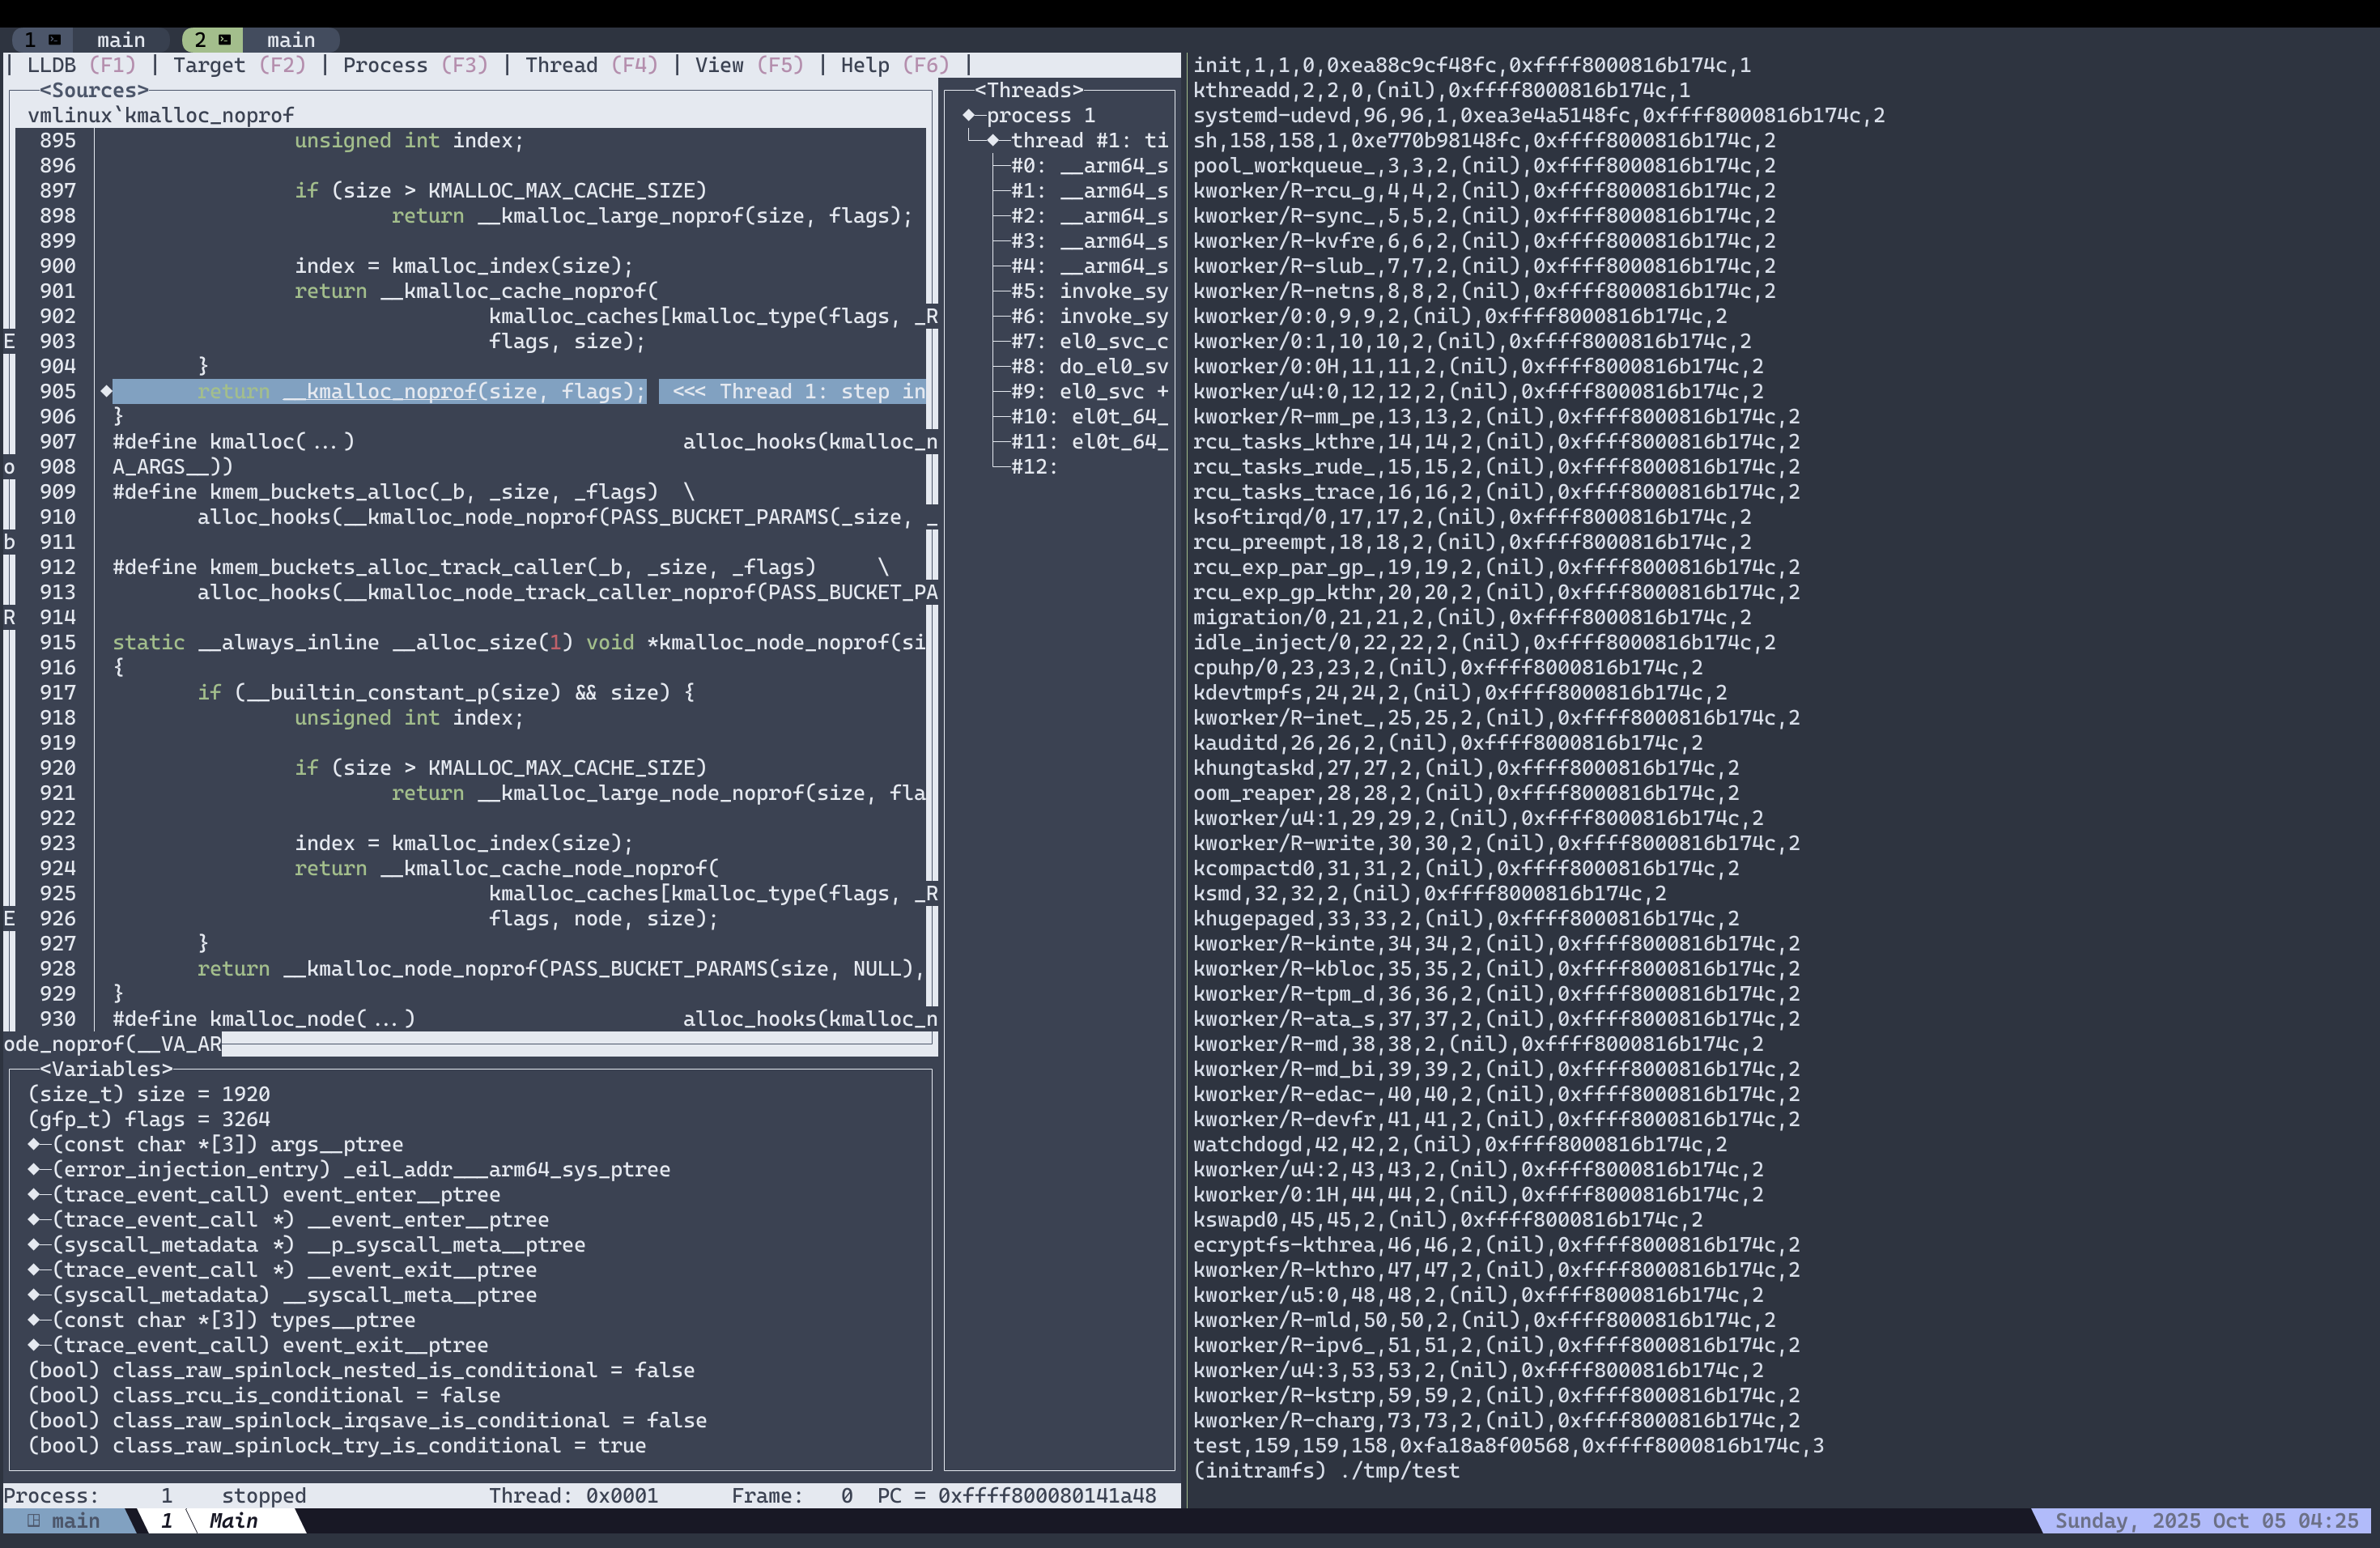
Your workflow now gets a bit more interesting: you would likely alternate
between the two terminals: set some breakpoint on the functions you want to see,
running c in gdb to get back to the QEMU shell, run your custom binary which
could possibly invoke your new syscall, wait for QEMU to get stuck on the
breakpoint, return to gdb to analyze and walk the instructions, and then rinse
and repeat.
Editor Integration - Neovim
(Sorry I don’t know how regular vim should be setup)
Include the following in your lazy configs:
local pretty_print = {
  {
    text = "-enable-pretty-printing",
    description = "enable pretty printing",
    ignoreFailures = false,
  },
}

return {
  {
    "mfussenegger/nvim-dap",
    cmd = { "DapNew" },
    config = function()
      local dap = require("dap")

      -- uses `cpptools` from vsc; install using mason -- you have mason, right?
      dap.adapters.cppdbg = {
        id = "cppdbg",
        type = "executable",
        command = "OpenDebugAD7",
      }

      dap.configurations.c = {
        {
          name = "Launch file",
          type = "cppdbg",
          request = "launch",
          program = function()
            return vim.fn.input("Path to executable: ", vim.fn.getcwd() .. "/", "file")
          end,
          cwd = "${workspaceFolder}",
          stopAtEntry = true,
          setupCommands = pretty_print,
        },
        {
          name = "Attach to gdbserver :1234",
          type = "cppdbg",
          request = "launch",
          MIMode = "gdb",
          miDebuggerServerAddress = "localhost:1234",
          miDebuggerPath = "/usr/bin/gdb",
          cwd = "${workspaceFolder}",
          program = function()
            return vim.fn.input("Path to executable: ", vim.fn.getcwd() .. "/", "file")
          end,
          setupCommands = pretty_print,
        },
      }
      dap.configurations.cpp = dap.configurations.c
    end,
  },
  {
    "rcarriga/nvim-dap-ui",
    cmd = { "DapUI" },
    dependencies = {
      "mfussenegger/nvim-dap",
      "nvim-neotest/nvim-nio",
    },
    config = function()
      local dap = require("dap")
      local dapui = require("dapui")
      dapui.setup()

      -- manual cmds for dapui
      vim.api.nvim_create_user_command("DapUIOpen", dapui.open, {})
      vim.api.nvim_create_user_command("DapUIClose", dapui.close, {})
      vim.api.nvim_create_user_command("DapUI", dapui.toggle, {})

      vim.api.nvim_create_user_command("Debugger", function()
        dapui.open()
        dap.continue()
      end, {})
    end,
  },
}
This gives you a wrapper command “Debugger”. Once you start QEMU the way
described above, instead of running gdb, you open the files you want to edit
in the linux kernel with neovim, then run Debugger, choose
Attach to gdbserver, and input the path to vmlinux (you might need to input
a few ../s). You should now be able to interact with gdb using the DAP
protocol, though I would also recommend having some number of custom keybinds to
the various Dap operations, e.g. DapToggleBreakpoint.
I personally use hydra to create a special debug mode for debugging-specific keybinds.